GUIDO PETRI
Tableau

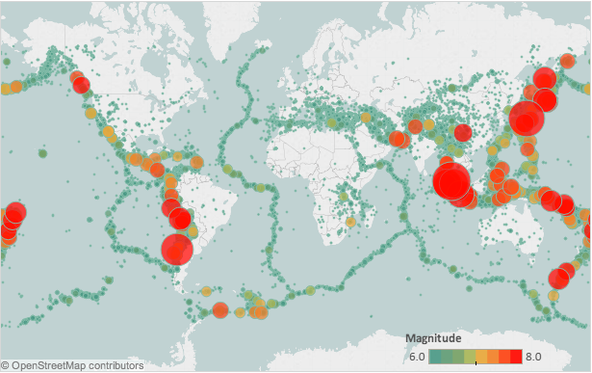
As part of my job, I started learning how to use Tableau. As it turns out, visualizing data is pretty cool. Who would have thought?
I initially started my experience with Tableau Desktop, but we quickly realized that to roll it out to a broader audience, we'd need Tableau Server. So I was in charge of setting up our whole infrastructure! Needless to say, I learned a lot about server architecture in general, and a lot about Tableau Server, specifically. Now that most of the heavy lifting is done, all that is left is creating dashboards with the Desktop version and uploading them to Server.
At some point, I might get a personal license for Tableau - but honestly, I might just use free, open-source graphing libraries like seaborn instead. I imagine it wouldn't be too difficult to schedule a few cron jobs and have the output of the scripts up on a page. Who knows - maybe I'll even try to make them interactive and use Bokeh or (if I'm brave enough!) D3.